the Creative Commons Attribution 4.0 License.
the Creative Commons Attribution 4.0 License.
 | 11 Sep 2018
Quantitative analysis of suture lines in Carboniferous ammonoids
Michael Wegerer
Kenneth De Baets
Two morphometric methods are applied and compared for the analysis of suture lines in Early Carboniferous ammonoids of the superfamilies Pericycloidea, Girtyoceratoidea and Goniatitoidea. We analysed (1) classic metric data (proportions of the width and depths or heights of lobes and saddles) using multivariate statistic methods and (2) outline data of the external lobe and the ventrolateral saddle of the same ammonoid taxa using the elliptic Fourier analysis. Both methods lead to similar results and simultaneously demonstrate ontogenetic and phylogenetic trends of these ammonoids. Our results are consistent with three previously suggested evolutionary patterns: (1) a general decrease of the amplitude of lobes and saddles, (2) a proportional widening of the external lobe and (3) a heightening of the median saddle.
- Article
(18679 KB) -
Supplement
(1207 KB) - BibTeX
- EndNote


The scientific branch of morphometrics, i.e. the quantitative investigation of biological shape variation (Bookstein, 1996), has a long history. The description of the organisms by means of their shape and proportions allowed for a classification of biological objects; the study and evaluation of morphological characters enabled the development of a taxonomic hierarchy. Newly found organisms could easily be attributed into the zoological nomenclature introduced by von Linné (1758). However, with the increasing number of described taxa it became clear that a strict separation between the species and their intraspecific variation became somewhat problematic (e.g. De Baets et al., 2015). Additional to the qualitative approaches, quantitative analyses are becoming increasingly important.
The classic investigations of shape variation in organisms were mainly based on metric parameters. Francis Galton (Galton, 1883) proposed an approach towards a quantitative differentiation between human faces, later known as two-point shape coordinates or Bookstein shape coordinates (BCs). An approach towards the analysis of geometric shape differences was developed by the mathematician D'Arcy W. Thompson (Thompson, 1917) in his seminal book On Growth and Form. However, the methodology of this time faced the problem that the morphological characters and their relationships were difficult to analyse and only with the advent of multivariate morphometrics could these be statistically investigated (Mitteroecker and Gunz, 2009).
With the availability of powerful computers at the end of the 20th century, the development of the “statistical theory of shape” has been driven forward (e.g. Lazarus, 1986). This allowed for the application of new methods in the generation of large multi-dimensional data sets and the use of statistical tests based on resampling procedures (Mitteroecker and Gunz, 2009). This new branch of morphometrics has been named “geometric morphometrics” (Corti, 1993; Adams et al., 2013; Gerber, 2017).
Geometric morphometrics is mainly based on the analysis of coordinates and their relationships. Frequently used methods are the landmark analysis and the outline analysis (Bookstein, 1991). Landmarks are distinct places in the shape of the investigated specimen (such as meeting points of sutures between bones) or points of maximal extension (such as tip of the nose or the point of a fin). Such points have to be homologous, if possible. They can be acquired using digitization tools such as tps-Dig (Rohlf, 2011) or the package Geomroph in R (Adams and Otárola-Castillo, 2013). If a statistically sufficient number of homologous landmarks are not available, semi-landmarks (“sliding landmarks”) can be used for a Procrustes analysis, first performed by Bookstein (1991). These are points along an outline of a form, which are determined by distinct mathematic procedures; they can be used for the analysis of objects with a smooth outline, where homologous landmarks cannot be determined. The number of semi-landmarks has to be the same in all analysed objects and some geometric similarity of the objects must be given.
Another important morphometric method is the study of the outline of an object (outline analysis, contour analysis) with the application of Fourier analysis. Closed outlines without homologous landmarks can be quantified by using this method. Objects with a simple or primitive outline, in which the radii beginning from the centre meet the outline only once, can easily be studied with the application of the classical Fourier analysis. Elliptic Fourier analysis (EFA; Kuhl and Giardinia, 1982) enables the study of complex outlines, i.e. those in which the radii meet the outline more than once.
Methods of morphometrics have become increasingly important for palaeontology within the last few decades. The change of the purely descriptive, conservative morphology towards the quantitative science at the beginning of the 20th century has been named the “quantification revolution” (Bookstein, 1998). Shape variations within or between organism groups can be described with the more completed arsenal of multivariate, statistical methods (Adams et al., 2004). For this, distance measurements, angles and proportions between distances can be used for the analysis. After the establishment of the geometric morphometrics at the end of the 20th century, the use of these methods was extended; landmark and outline analyses have been used in a number of research projects (for an overview, see MacLeod, 2002). These can now also be easily acquired from three-dimensional objects (e.g. Polly and Motz, 2016).
Another research topic that is at the centre of interest is the application of quantitative morphometric methods in phylogenetic and evolutionary studies, also in ammonoids (e.g. Monnet et al., 2011; Bookstein and Ward, 2013; see review in Monnet et al., 2015). MacLeod (2002) and Adams et al. (2004) pointed out the various difficulties associated with this method, but they also stated that it could be used to supplement other phylogenetic or evolutionary approaches (see also Monnet et al., 2011; Collyer and Adams, 2013; Adams, 2014). Polly (2008) discussed the role of morphometrics in the study of evolutionary novelties, which can appear almost suddenly (Klingenberg, 2008). Therefore, Polly (2008) proposed the application of homology-free methods such as outline analyses for the quantification of morphological change.
Because of their high value for phylogeny and taxonomy, suture lines have frequently been chosen for detailed investigations of Palaeozoic ammonoids (Kullmann and Wiedmann, 1970; Wiedmann and Kullmann, 1981; Saunders and Work, 1996, 1997; Korn, 1997; Korn and Klug, 2002) and have also been used for development of quantitative methods to study these structures through time (Boyajian and Lutz, 1992; Pérez-Claros et al., 2002; Allen, 2006, 2007; Saunders et al., 2008; Ubukata et al., 2010, 2014; Yacobucci and Manship, 2011). Many additional quantitative studies have focused on Post-Paleozoic ammonoids (Olóriz et al., 1997, 1999; Pérez-Claros et al., 2007; Yacobucci and Manship, 2011; Pérez-Claros and Bengtson, 2018).
Various methods for the analyses of suture lines have been applied, including the study of the fractal geometry (e.g. Boyajian and Lutz, 1992; Lutz and Boyajian, 1995; Olóriz et al., 1997, 1999; Pérez-Claros et al., 2002). These studies focused mainly on the Mesozoic ammonoid suture lines and followed mathematical analyses to describe complex sutural elements (e.g. Canfield and Anstey, 1981; Long, 1985; Damiani, 1990; Manship, 2004). In the future, the emerging importance of 3-D techniques will receive increasing attention for the study of ammonoid sutures (e.g. Hoffmann et al., 2018), which is of interest as the complexity of suture lines must to some degree be related to the complexity of the septa and soft tissues. However, it will take some time to have a representative data set for these purposes. Furthermore, due to insufficient preservation and lack of material, such data will be impossible to obtain for some taxa only.
The quantitative illustration of morphological differences with the aid of Fourier analysis methods between suture lines (Gildner, 2003; Allen, 2006, 2007), ribs (Dommergues et al., 2007) or other structures like cephalopod hooks (Hoffmann et al., 2017) has been of great scientific interest within the last few decades. Their application on suture lines, however, has only been shown as reliable and reproducible within certain limits, particularly if the investigated suture lines are very complex and brought the Fourier methods close to their limits (Allen, 2006).
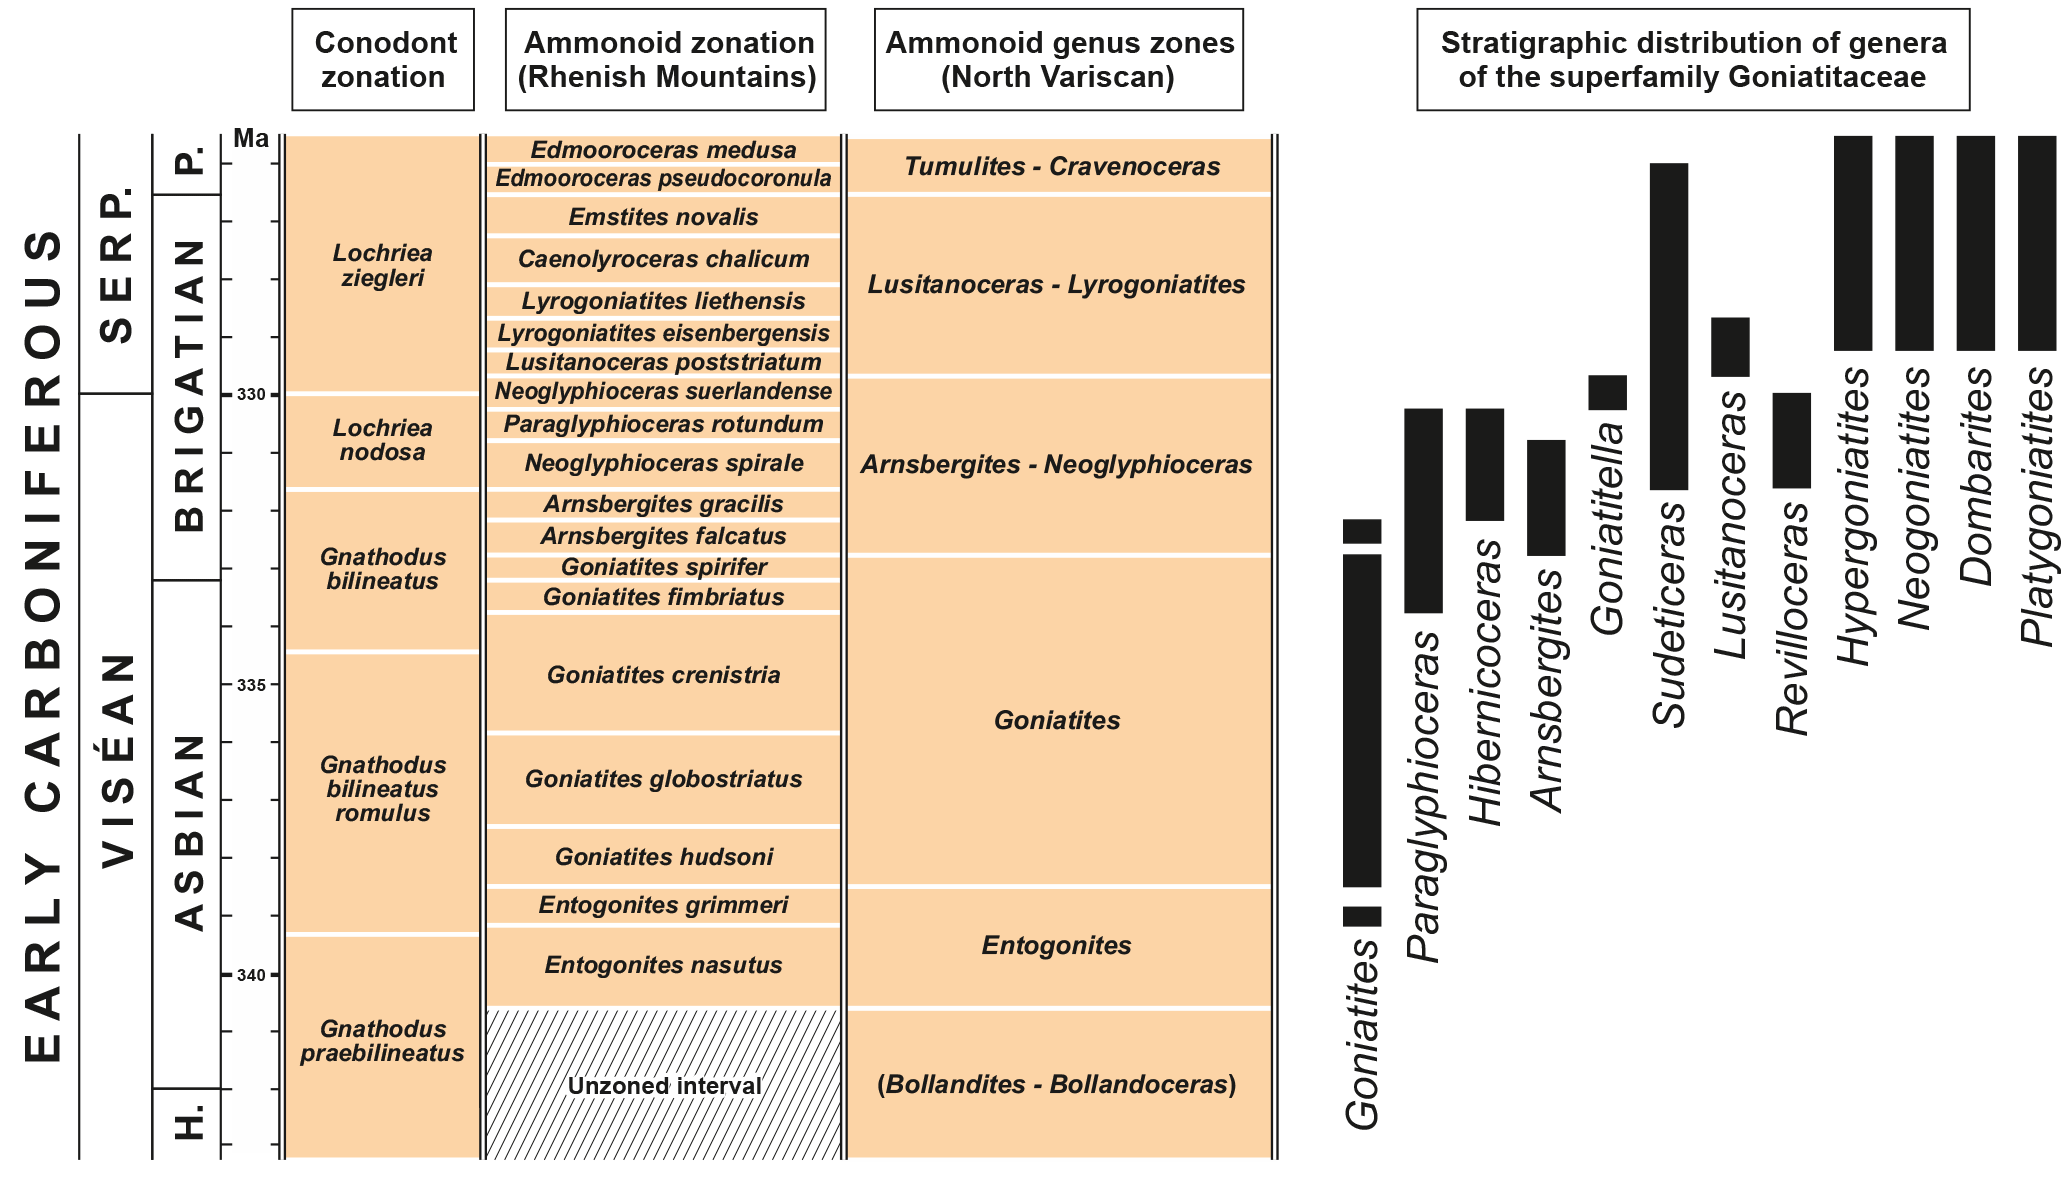
Figure 1Stratigraphic distribution of the genera in the superfamily Goniatitoidea analysed in this study. Relative lengths of the ammonoid zones after Korn and Kaufmann (2009), conodont stratigraphy after Meischner and Nemyrovska (1999) and Wang et al. (2018).
In this study, we quantitatively analyse suture lines of Early Carboniferous ammonoids; a morphospace for these suture lines will be outlined. We apply two methods of morphometric analysis for the purpose of a comparison of the results by studying Early Carboniferous ammonoids: (1) the analysis using distances between semi-landmarks (analysis of metric data) and (2) the outline analysis using the EFA.
2.1 Material
The focus of this study is the Early Carboniferous superfamily Goniatitoidea de Haan, 1825 for a number of reasons: (1) it is a very diverse superfamily with many genera and species, (2) it shows high evolutionary rates with short-ranging taxa, (3) it is represented by large material, (4) it shows, despite the rather simple “goniatitic” suture line, numerous characteristic features that allow for a detailed morphometric analysis (e.g. Ruzhencev and Bogoslovskaya, 1971; Korn, 1988) and (5) all analysed species share a similar conch morphology so that differences in the suture lines due to covariation with conch geometry can largely be ruled out.
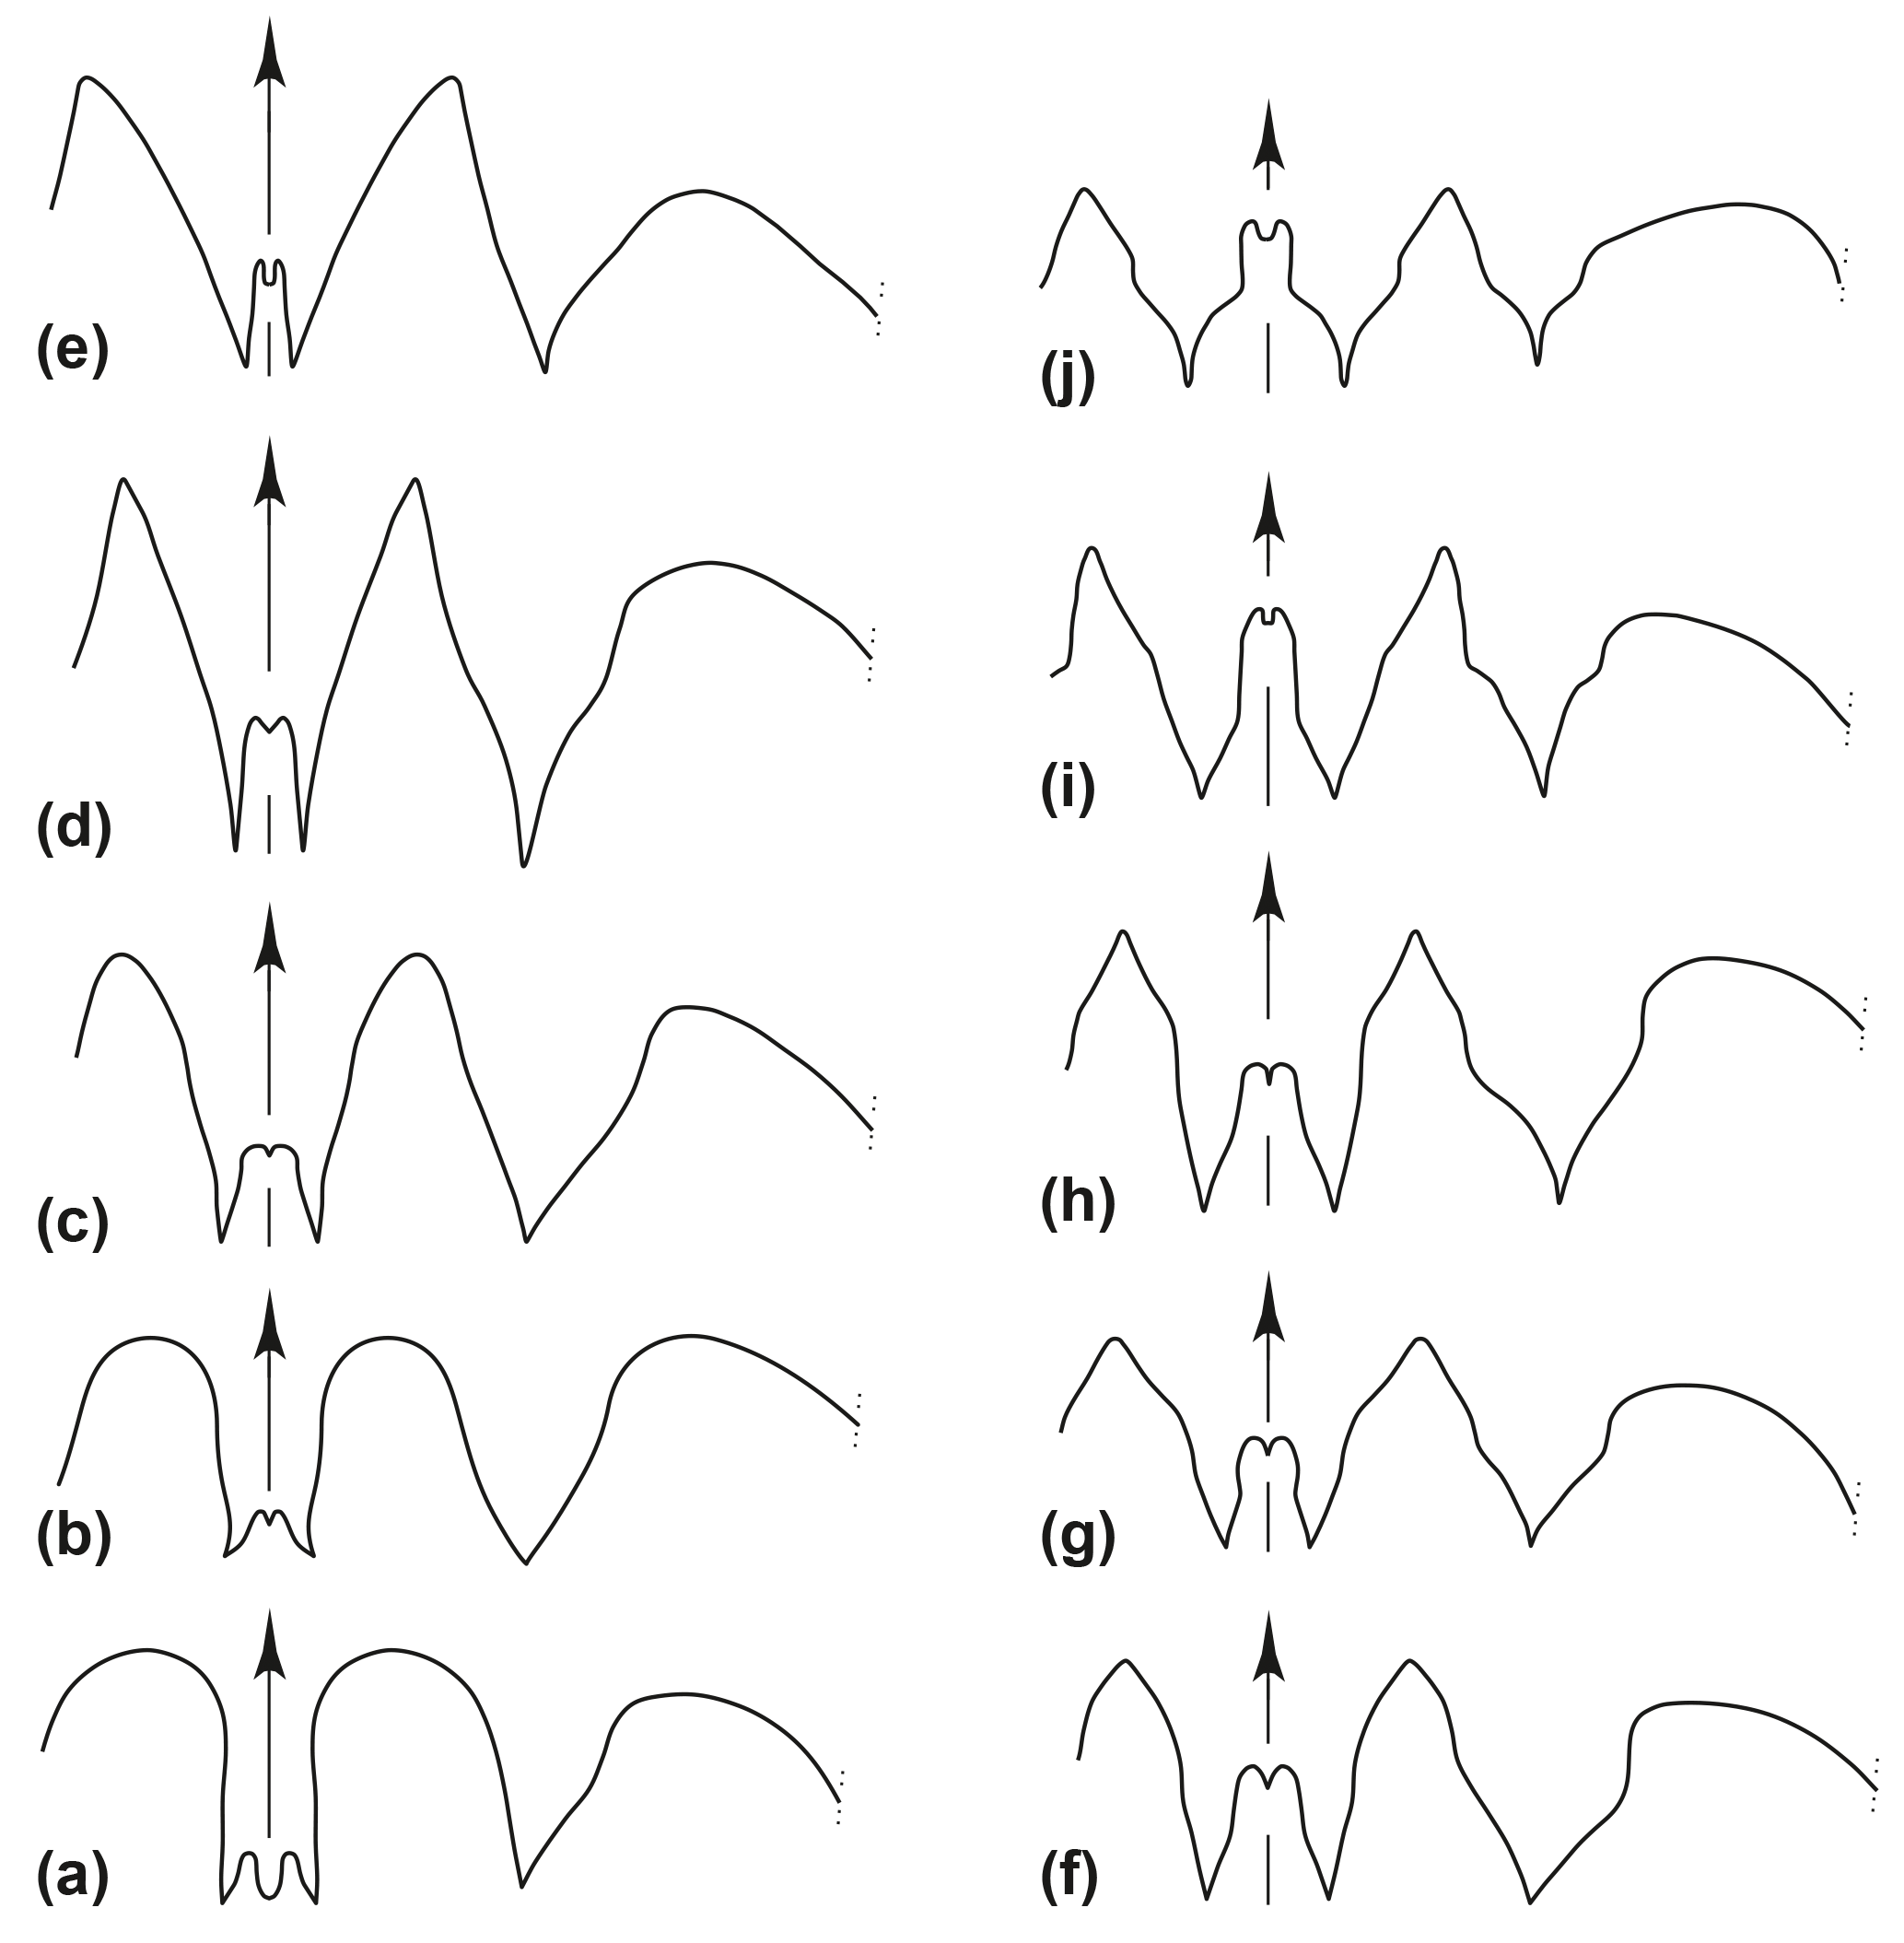
Figure 2Suture lines of representatives of Early Carboniferous suborder Goniatitina (a, b superfamily Pericycloidea; c–j superfamily Goniatitidae). (a) Trimorphoceras absolutum Ebbighausen, Korn & Bockwinkel, 2010; holotype MB.C.18611.1. (b) Bollandites nitens Bockwinkel, Korn & Ebbighausen, 2010; holotype MB.C.18682.1. (c) Goniatites lazarus Korn, Klug & Mapes, 1999; specimen MB.C.5307. (d) Goniatites rodioni Korn & Ebbighausen, 2006; paratype MB.C.9084.7. (e) Hypergoniatites tenuiliratus Ruzhencev & Bogoslovskaya, 1971 (after Ruzhencev and Bogoslovskaya, 1971). (f) Arnsbergites ferrus Korn & Ebbighausen, 2008; holotype MB.C.13291.1. (g) Lusitanoceras zirari Korn & Ebbighausen, 2008; holotype MB.C.13296. (h) Revilloceras granofalcatum (Kullmann, 1961); specimen MB.C.9031.3. (i) Dombarites paratectus Ruzhencev & Bogoslovskaya, 1971 (after Ruzhencev and Bogoslovskaya, 1971). (j) Platygoniatites molaris Ruzhencev & Bogoslovskaya, 1971 (reproduced from Ruzhencev and Bogoslovskaya, 1971; Korn et al., 2005; Klug et al., 2006; Korn and Ebbighausen, 2008; Bockwinkel et al., 2010; Ebbighausen et al., 2010).
This superfamily emerged with several representatives in the early Late Tournaisian (Korn et al., 2003, 2010). Early and Middle Viséan representatives are unknown, but it is widely distributed in the Late Viséan (Korn et al., 2005). During the early Late Viséan (Asbian of the British chronostratigraphic scheme), the typical genus Goniatites had an almost global distribution (Korn et al., 2005, 2012), but significant differences occur in the distribution of the superfamily in the latest Viséan (late Brigantian) and early Serpukhovian (Ruzhencev and Bogoslovskaya, 1971; Korn, 1997; Korn et al., 2012; Titus et al., 2015). However, in some regions, such as the South Urals, the Cantabrian Mountains of Spain and the Anti-Atlas of Morocco, the superfamily has a continuous record across the Viséan–Serpukhovian boundary. Other regions such as the North Variscan show a truncation of the distribution of the superfamily within the Late Viséan (Fig. 1) (Korn et al., 2012).
The superfamily Goniatitoidea contains the families Goniatitidae, Agathiceratidae and Delepinoceratidae with a total of about 25 genera. The numerous species are characterized by distinct features in the suture line as well as conch geometry and ornament. All species possess a V-shaped or Y-shaped external lobe and a narrowly rounded to acute ventrolateral saddle (Fig. 2). According to the suture line terminology proposed by Wedekind (1918), it has the formula (E1 Em E1) A L U I; in the terminology used in the American and Russian literature the formula is (V2 V1 V2) L U I D (e.g. Ruzhencev, 1960). In the phylogenetic development of the Viséan and Serpukhovian species, several trends in suture line evolution can be observed (Ruzhencev and Bogoslovskaya, 1971; Korn, 1997). The three most important trends are (1) a general decrease of the amplitude of lobes and saddles, (2) the width increase of the external lobe and (3) the height increase of the median saddle. Based on these trends and trends in conch ontogeny, Korn (1997) postulated the existence of several phylogenetic lineages within the superfamily Goniatitoidea with Progoniatites being the ancestral genus.
The suture lines of 55 species out of Goniatitoidea were analysed and compared with some representatives of the superfamilies Pericycloidea and Girtyoceratoidea (Early Carboniferous Goniatitida; Supplement). The suture lines used in this study were obtained from various monographs on Carboniferous ammonoids (Ruzhencev and Bogoslovskaya, 1971; Korn, 1988, 2017; Korn et al., 2005, 2010; Klug et al., 2006; Korn and Ebbighausen, 2008; Bockwinkel et al., 2010; Ebbighausen et al., 2010; Korn and Titus, 2011). For comparability, suture lines of specimens between 20 and 30 mm phragmocone diameter were chosen preferably.

2.2 Methods
Outline tracing and Fourier analysis
All suture lines were digitized and thereafter precisely aligned and scaled for a standard procedure (e.g. Furnish and Unklesbay, 1940). The vast majority of the analysed suture lines were drawn by one of us (Dieter Korn) and published in various articles; additionally, suture drawings provided by Ruzhencev and Bogoslovskaya (1971) were digitized (Fig. 3).
Two sutural elements were used in the quantitative analysis, (1) the external lobe (E lobe) and (2) the ventrolateral saddle (VL saddle). These two regions possess a convenient number of distinct characters and are not too complex for a Fourier analysis. The use of these two sutural elements allows for a quantification of various aspects of the superficially rather similar suture lines:
-
the width ratio of the external lobe, ventrolateral saddle and adventive lobe
-
the width ∕ depth ratio of the E lobe
-
the height of the median saddle
-
the degree of divergence of the E lobe flanks
-
the curvature of the E lobe flanks
-
the width ∕ height ratio of the ventrolateral saddle
-
the general shape of the VL saddle.
For the Fourier analysis, the two digitized regions (E lobe and VL saddle) were separated and the curves of these two sutural elements were closed with a connecting line. The resulting geometric shapes were filled with black and then exported as a TIFF file. Outline tracing was achieved with the tps-Dig software (Version 2.12; Rohlf, 2011). For the outline of the E lobe, 200 x–y coordinates were defined and 100 coordinates for the VL saddle. These numbers of coordinates were chosen with respect to the complexity of the studied outlines.
The E lobe, however, is a rather complex structure and hence the EFA (Kuhl and Giardinia, 1982) was used. In the EFA the primary data (x–y coordinates) of the outlines are transformed into mathematical functions. The classic Fourier analysis, in which the coordinates of the outline are gained by measuring the radii by rotation of the analysed shape around the centroid, could not be used in our material because the radii meet the outline of the suture line more than once. The EFA separates the information of the outline data into a series of ordered Fourier coefficients (the sums of sine and cosine functions), the so-called “harmonics” (Kuhl and Giardinia, 1982; Le Minor and Schmittbuhl, 1999). These harmonics are characterized by their elliptical shape, of which each ellipse is characteristically defined by four parameters (elliptical descriptors). The precision increases with increasing number of harmonics.

Figure 4Fitting of outline tracing in suture lines using 30 harmonics to represent the outline of the external lobe.
In our study, we used the comparatively high number of 30 harmonics to reach a convenient degree of precision, particularly for a sufficient representation of the prongs of the external lobe (Fig. 4). The coefficients of the suture lines were gained by the EFA using the program PAST (version 3.11; Hammer et al., 2001). Before this, we rescaled the coordinate data by Procrustes superimposition (standard size), then aligned (standard position) and finally rotated (standard orientation) them. We gained independent data sets Fourier coefficients for the external and the ventrolateral saddle, but for later processing, these two data sets were subsumed. A principal component analysis (PCA) using the correlation mode further processed this data set.

Metric data and their analysis
For a comparison of the results gained by the outline analysis, we achieved an analysis of the metric data, using suture lines of 55 representatives of the Goniatitoidea. The following measurements of sutural elements were obtained (Fig. 5):
-
external lobe (EL): the depth (ELd) and nine measurements of its width at different places (from the bottom to the top, EL1–EL9); a total of 13 ratios were calculated:
This means that the first four ratios are interelement ratios (comparisons with the VL saddle); they are influenced by the general outline of the suture line, e.g. the amplitude of the sutural elements. The other nine are intraelement ratios (ratios within the E lobe), which provide information about the general shape of the E lobe and the degree of divergence of the flanks and their curvature.
-
median saddle height (MSh); the height ratio with the external lobe was calculated (MSh∕ELd).
-
ventrolateral saddle: its height (which is the same measurement as the depth of the external lobe; ELd) and four measurements of width (VLS1–VLS4) were measured; four ratios were calculated:
-
adventive lobe width (AL1) at its half depth.
The data set consisting of ratio data has been analysed using the program PAST (Version 1.88; Hammer et al., 2001) in a PCA. In a second attempt, the proportional width data of the external lobe, ventrolateral saddle and adventive lobe, all measured at half height of the suture line (measurements EL5, VLS3, AL1), were illustrated in a ternary diagram.
We performed two types of analyses with respect to early Carboniferous ammonoid suture lines; a Fourier outline analysis was performed with two different data sets (one analysing various superfamilies and one focusing on Goniatitoidea) and one additional analysis was using metric data. For the latter, we also applied an analysis producing a ternary diagram.
3.1 Fourier outline analysis 1 (various superfamilies)
We analysed 62 Early Carboniferous ammonoid species of the superfamilies Pericycloidea, Girtyoceratoidea, Neoglyphioceratoidea and Goniatitoidea (Supplement).
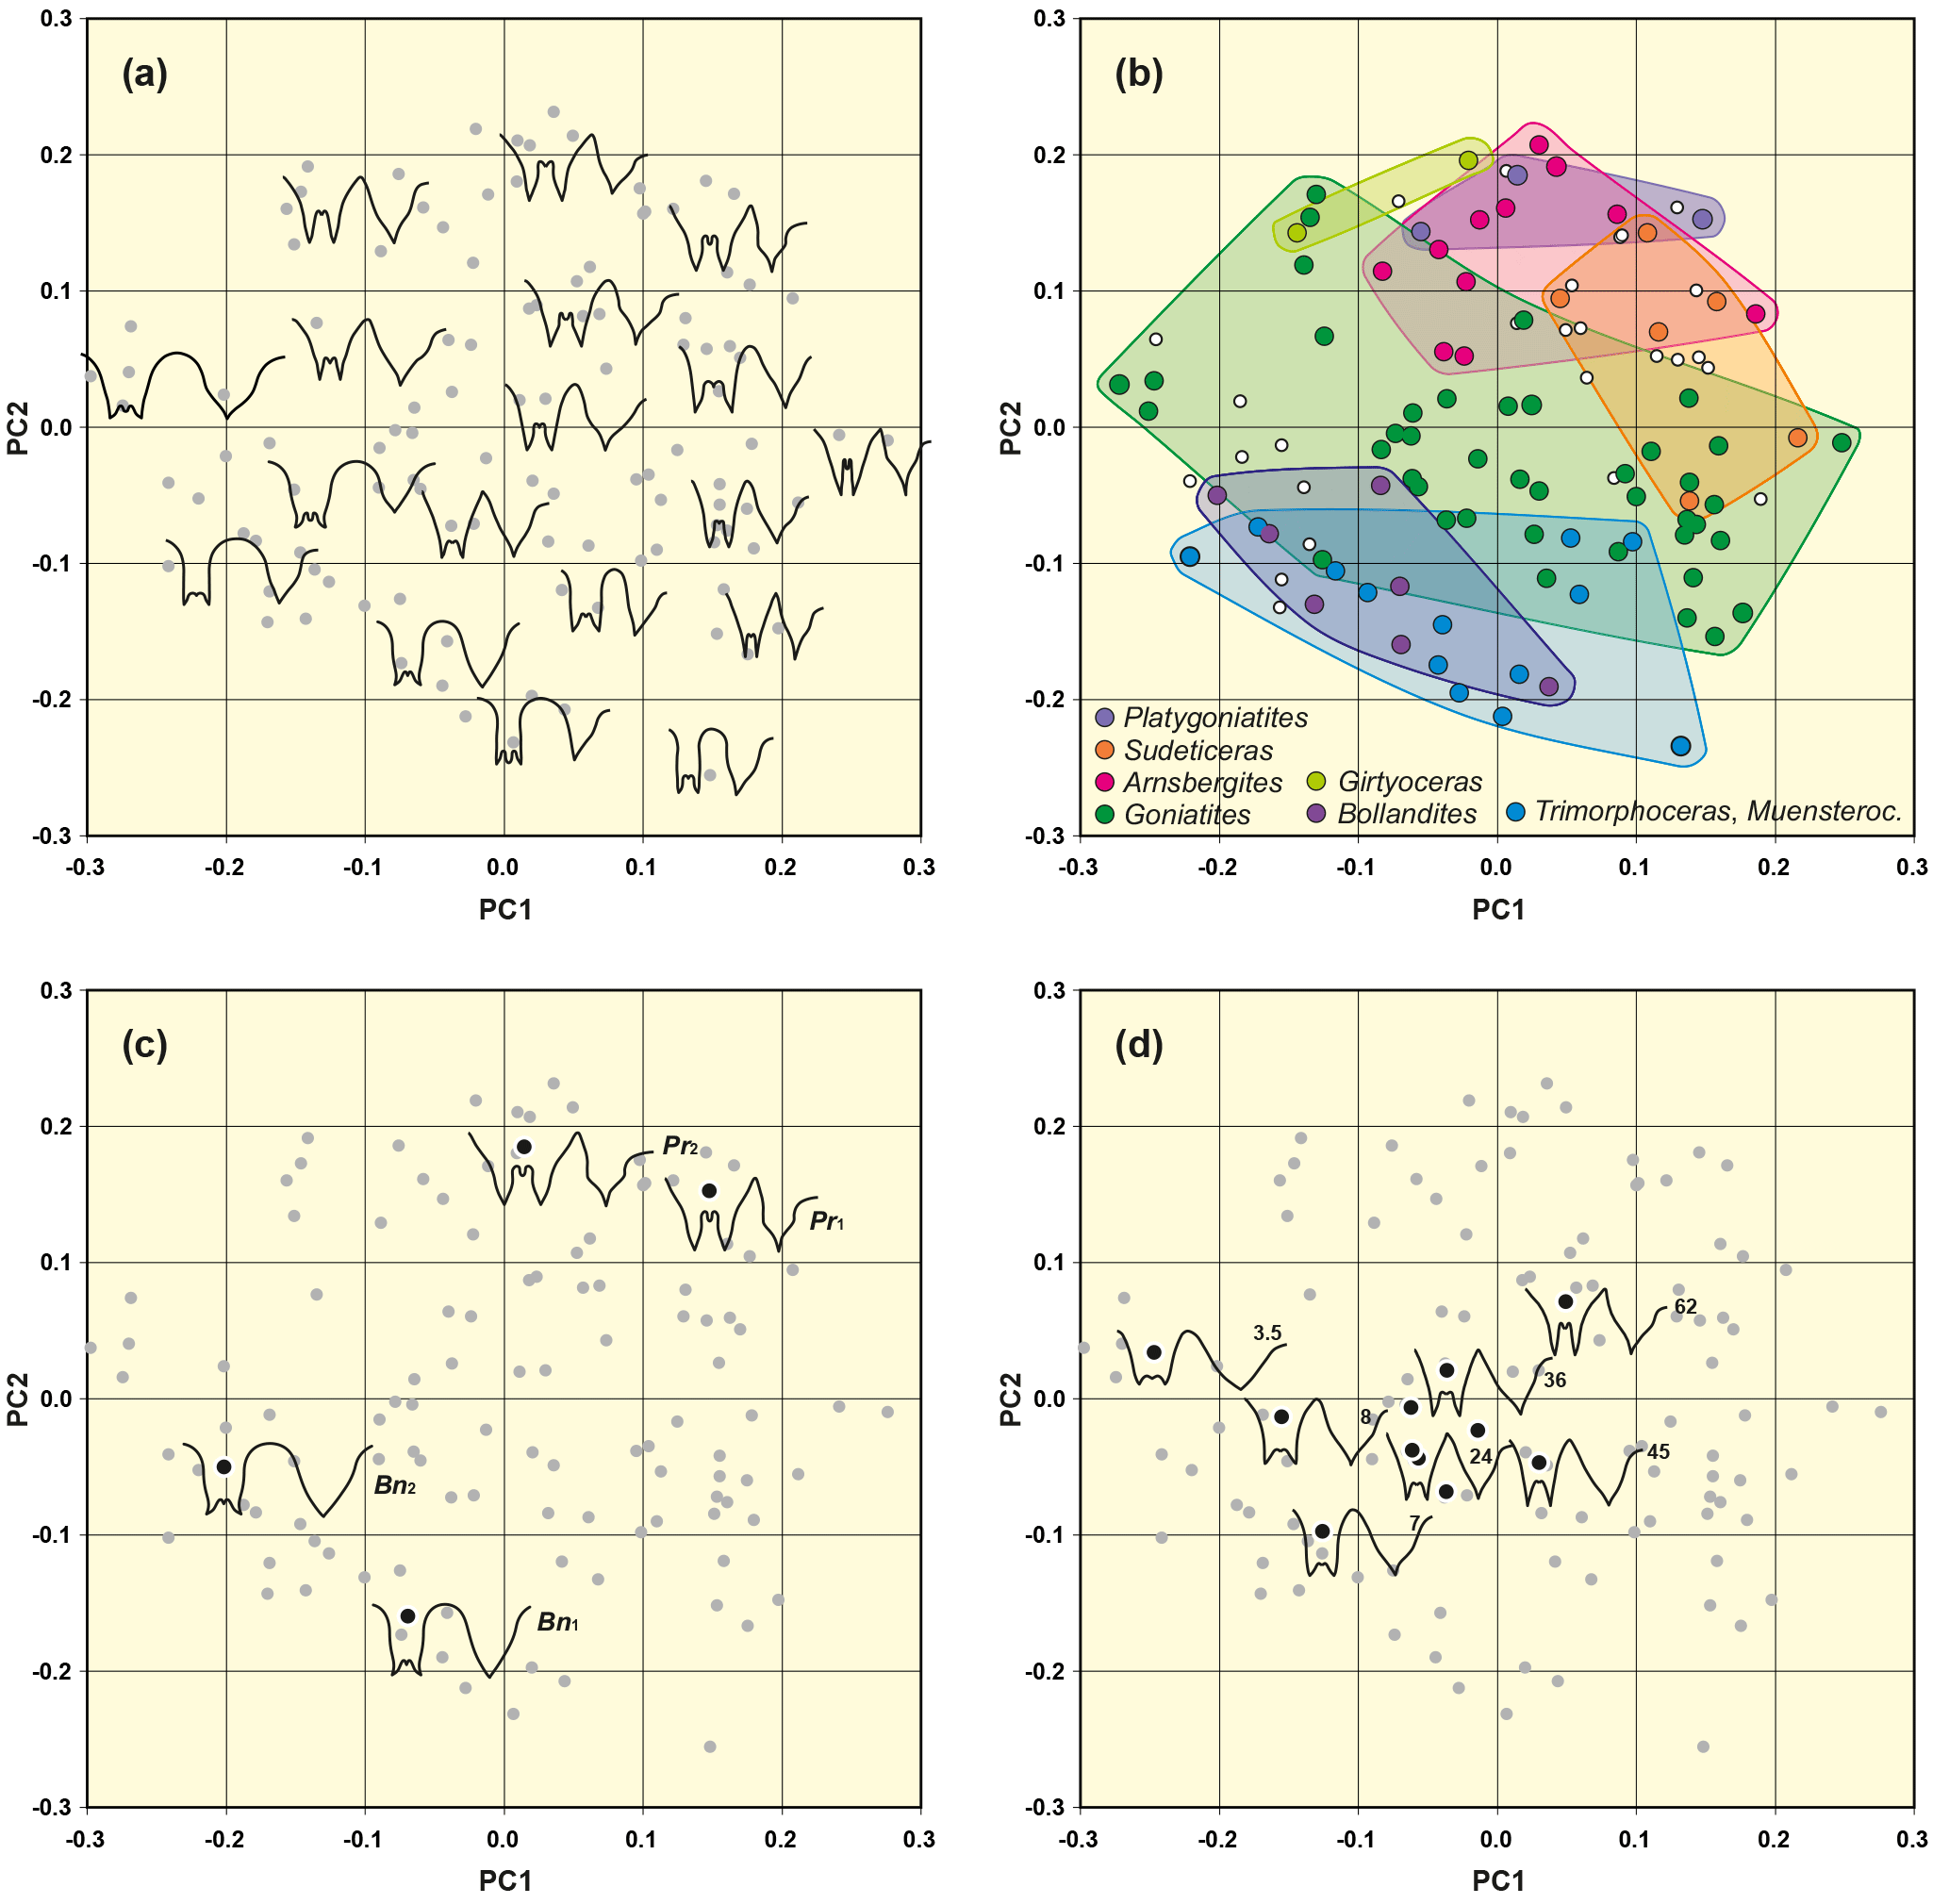
Figure 6Result of outline analysis 1, based on 111 suture lines of representatives of the superfamilies Goniatitoidea, Pericycloidea and Girtyoceratoidea. (a) Representative suture lines are included in the scatter plot to demonstrate the representation of different sutural outlines in the morphospace. (b) Position of selected genera in the morphospace. (c) Highlighted suture lines and positions in the morphospace of two modified suture lines (both laterally extended by a factor of 1.2). Bn – Bollandoceras nitens Bockwinkel et al., 2010; Pr – Platygoniatites rhanemensis Korn & Ebbighausen, 2006. (d) Highlighted suture lines and positions in the morphospace of seven specimens of Goniatites crenistria Phillips, 1836 (from Korn, 1988). Numbers adjacent to the suture lines indicate the conch diameter, at which the suture line has been obtained.
Analysis
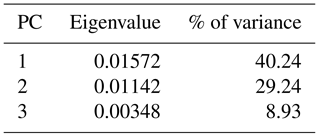
Fourier outline analysis 1, which was done for overview purposes, was realized with the analysis of 109 suture lines (mostly of specimens with phragmocone diameters of 20–30 mm but including 10 ontogenetic stages of Goniatites crenistria) of a sample of Early Carboniferous ammonoids (mostly representatives of the superfamilies Goniatitoidea and Pericycloidea). The PCA (applying the variance–covariance algorithm) of the Fourier coefficients shows that the first two principal components explain already more than 69 % of the total morphological variance (Table 1).
Table 1Eigenvalue and percentages of variance for the first three principal components.
The distribution of data points within the PC1–PC2 morphospace diagram can be translated in terms of suture morphology (Fig. 6a):
-
shape of the external lobe: suture lines with a parallel E lobe are preferably positioned at the lower margin of the PC1–PC2 plot (low values of principal component 2); V-shaped external lobes show high values of PC2.
-
width of the external lobe (relative to its depth): suture lines with the narrowest E lobe are located at the lower right margin (high PC1 and low PC2 values) and sutures with a wide E lobe occupy the upper left region.
-
height of the median saddle (relative to ventrolateral saddle): the lower left area (low PC1 and low PC2 values) is represented by individuals with a low M saddle, while the upper right area is dominated by suture lines with high M saddles.
-
shape of the ventrolateral saddle: nearly concordant with the median saddle height, suture lines with a rounded VL saddle are concentrated at the lower left margin of the scatter plot.
Tendencies in the morphospace distribution by changes in the shape of the external lobe and ventrolateral saddle have been confirmed by adding two artificially modified suture lines; these suture lines were artificially widened by 20 %. A widening of the external lobe caused indirectly also a widening of the ventrolateral saddle because both structures have shared lines. This artificial modification led to an altered position within the morphospace (Fig. 6c). The points shifted to an upper left position within the morphospace thus indicating that this is the area for sutures with both widening of both the E lobe and the VL saddle.
Discussion
The distribution of the ammonoid species within the morphospace clearly reflects similarities and dissimilarities between the suture lines. All included genera of the superfamily Goniatitoidea (Arnsbergites, Goniatites, Platygoniatites, Dombarites, Revilloceras, Paraglyphioceras, Neogoniatites, Hypergoniatites and Lusitanoceras) plot together in a rather narrow area of the morphospace. The studied genera are positioned as follows in the PC1–PC2 diagram:
-
The analysed genera of the superfamily Goniatitoidea (Arnsbergites, Goniatites, Platygoniatites, Dombarites, Revilloceras, Paraglyphioceras, Neogoniatites, Hypergoniatites and Lusitanoceras) form a more or less cohesive point cloud.
-
Goniatites species show the widest skewing of the data points (Adams and Otárola-Castillo, 2013). This is mainly due to the fact that, for the documentation of ontogenetic changes in one selected species, juvenile suture lines of Goniatites crenistra have also been included in the analysis (Fig. 6d); the wide scattering is indicated by ontogenetic traits (beginning with a low median saddle). However, in this case, the main portion of the included suture lines are from juveniles, so the wide scattering can be explained by ontogenetically influenced morphological differences. For example, three individuals in the outer left region of the point cloud can be assigned to juvenile stages of Goniatites species, which can be characterized by a lower median saddle and a wide ventrolateral saddle. In diagram PC1–PC3, however, the distribution of Goniatites has a tendency to appear in the upper part of the point cloud.
-
The early Brigantian genera Arnsbergites, Hibernicoceras and Paraglyphioceras (with a relatively high M saddle and a moderately wide E lobe) are located in a small area in the upper right part within the scatter plot.
-
The late Brigantian to Serpukhovian genera Neogoniatites, Lusitanoceras and Dombarites (with an increasingly higher M saddle and moderate widening of the E lobe) occupy a marginal position in the upper right respectively upper (Lusitanoceras) area of the point cloud.
-
Sudeticeras with a wider E lobe and a relatively high M saddle are clustered in the upper middle of the morphospace.
-
The latest Brigantian to Serpukhovian genus Platygoniatites (with an increasingly higher M saddle and a rapid widening of the E lobe) is located in the upper region of the diagram.
-
These results show that the proposed phylogenetic lineage from Goniatites to Platygoniatites (Ruzhencev and Bogoslovskaya, 1971) is confirmed by the migration of the occupied field of the genera through the morphospace (Fig. 6b).
-
The representatives of the superfamily Pericycloidea possess a position at the lower left margin of the scatter plot because of their low median saddle, the rounded ventrolateral saddle and the external lobe with parallel to slightly divergent flanks.
This attempt shows that morphological differences of the goniatitic suture can be analysed and visualized quantitatively with a combined outline based, elliptic Fourier analysis (EFA) of the sections external lobe (and median saddle) and ventrolateral saddle.
3.2 Fourier outline analysis 2 (Goniatitoidea)
Analysis of representatives of the superfamily Goniatitoidea.
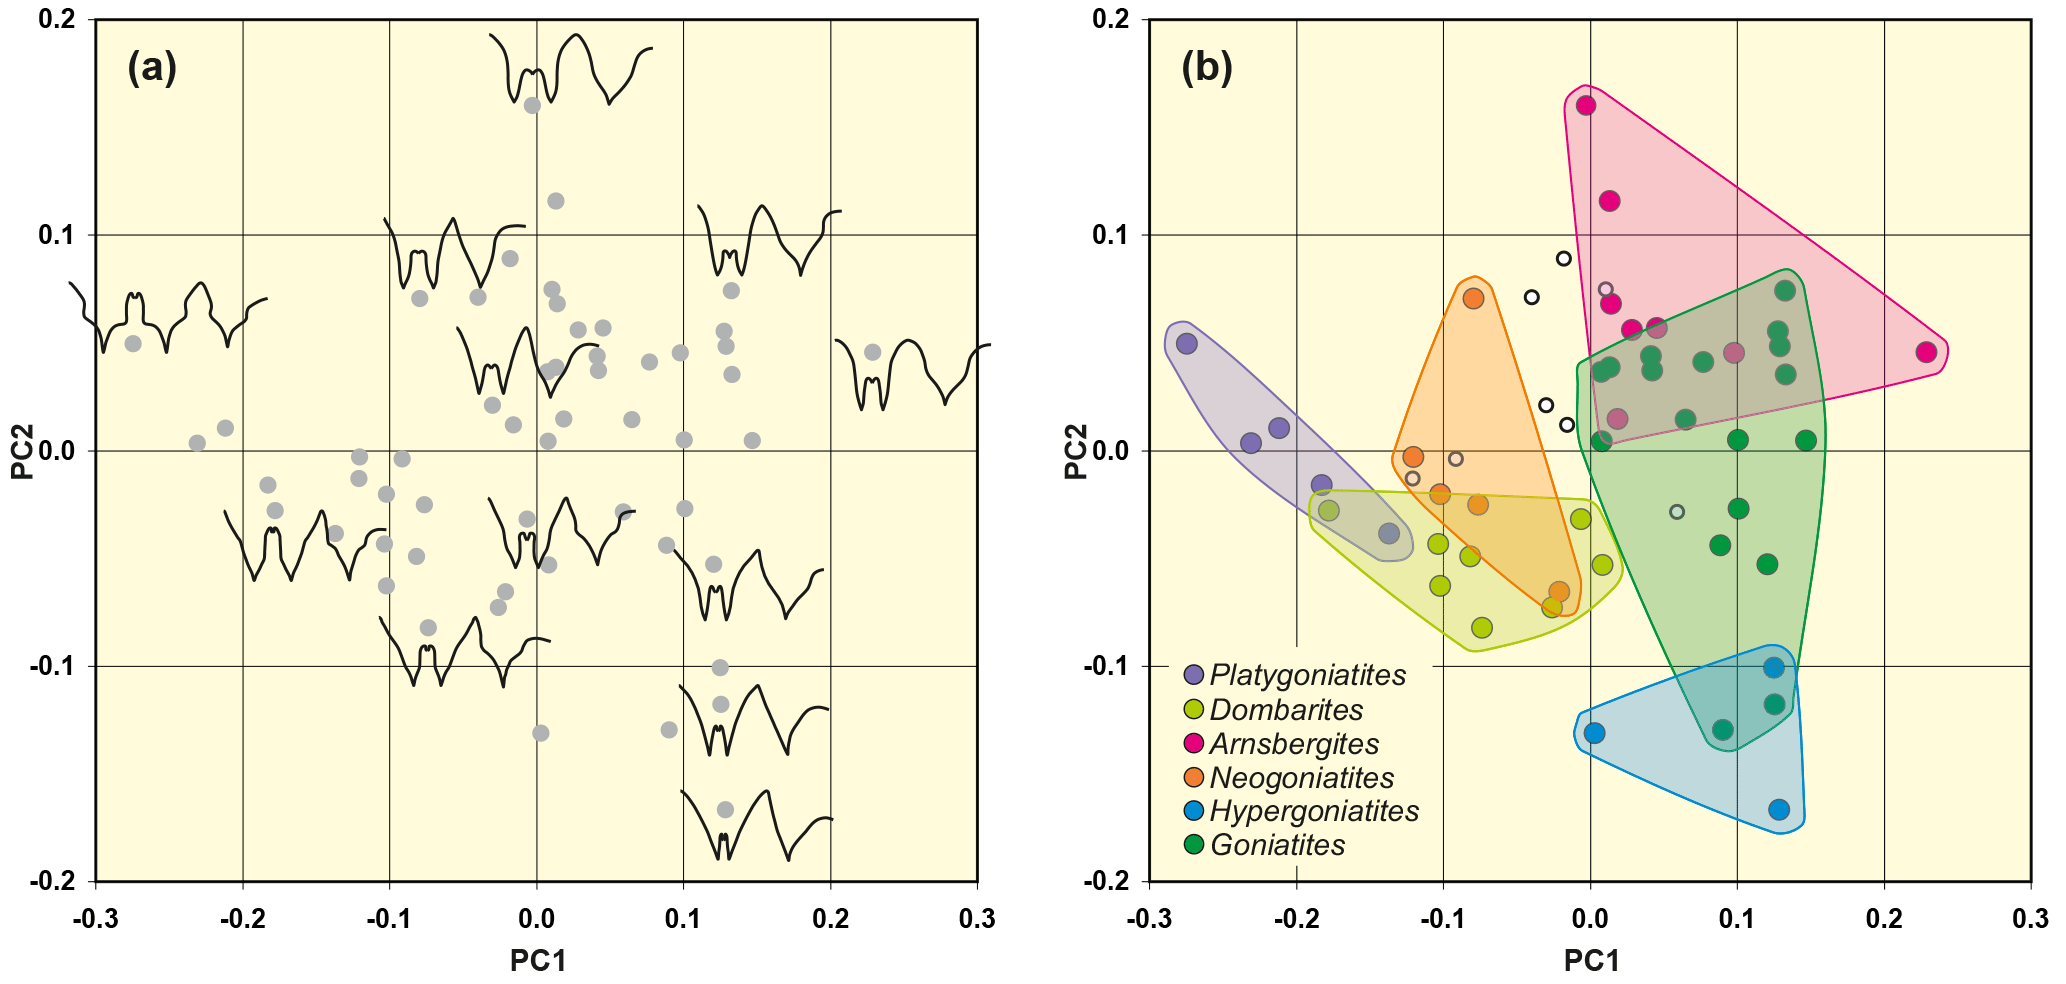
Figure 7Result of outline analysis 2, based on 55 suture lines of representatives of the superfamily Goniatitoidea. (a) Representative suture lines are included in the scatter plot to demonstrate the representation of different sutural outlines in the morphospace. (b) Position of selected genera in the morphospace.
Analysis
The suture lines of 55 individuals from the superfamily Goniatitoidea were used for this analysis (Supplement).
Table 2Eigenvalue and percentages of variance for the first three principal components.
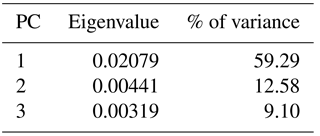
The percentage of variance that is explained by the first principal component is clearly higher here; the first two principal components explain about 72 % of the total variance (Table 2). The PC1–PC2 diagram (Fig. 7) shows the following patterns:
-
The width of the external lobe (relative to its depth) increases from the left (low PC1) to the right (high PC1) in the scatter plot. Therefore, Goniatites and Hypergoniatites, which possess a narrow E lobe, are located in the upper left area and Platygoniatites with its wide E lobe is positioned at the right margin of the morphospace.
-
The height of the median saddle (relative to the ventrolateral saddle) increases from the upper left area to the lower right area. Goniatites and Hypergoniatites with their low M saddle are therefore located in the upper left area of the morphospace. Dombarites and Platygoniatites with their high M saddle are positioned at the right margin of the morphospace.
-
Suture lines with strongly diverging flanks of the external lobe are located at the upper margin (high PC2 value), while more parallel-sided or Y-shaped external lobes are at the bottom of the morphospace (low PC2 values).
-
Suture lines with a rounded ventrolateral saddle are located in the lower left area; suture lines with acute ventrolateral saddles are mainly located in the upper right area.
-
Suture lines with tectiform ventrolateral saddles (i.e. with constricted flanks and a pointed top) occur in the lower right area while those with a simple triangular shape occupy the upper left area.
Discussion
By characterizing morphological aspects, the outline analysis can be a useful supporting tool to determine phylogenetic relationships. However, the consideration of other characteristics, like those of the conch shape, conch ontogeny and shell ornament, is necessary to test the results gained by the analysis of the suture line.
Figure 8Result of the morphometric analysis, based on 55 suture lines of representatives of the superfamily Goniatitoidea (same data set as for outline analysis 1). (a) Representative suture lines are included in the scatter plot to demonstrate the representation of different sutural outlines in the morphospace. (b) Position of selected genera in the morphospace.
3.3 Analysis of the metric data
Analysis
For a methodological comparison with outline analysis 2, a morphometric approach based only on metric data was made. For this, the same 55 individual suture lines of the Goniatitoidea from outline analysis 2 were examined (Supplement); 72.5 % of the total variance within the data set is explained by the first two principal components (Table 3).
Table 3Eigenvalue and percentages of variance for the first three principal components.
The morphospace plot (Fig. 8) shows the following characteristic features:
-
A widening of the external lobe from the lower right area (genera Goniatites and Hypergoniatites) to the middle left area (Platygoniatites) can be seen.
-
A similar distribution can be seen with the increase in the height of the median saddle. Parallel to the widening of the E lobe the median saddle becomes wider.
The distribution pattern is very similar to that of outline analysis 2, but the disposal appears to be rotated by 180∘. The similarities in the distribution pattern of metric analysis and outline analysis 2 are conspicuous, and hence the two methods can be used for testing one another. The analysis appears to have a sufficient repeatability.
Interpretation
The PC1–PC2 diagrams of the metric data analysis and outline analysis 2, which represent the same material, reveal a very similar distribution pattern. In both analyses, Goniatites and Hypergoniatites, which possess the narrowest external lobes, occupy a marginal position, in this case at the right margin of the morphospace plot.
Neogoniatites and Dombarites are located in the middle lower left area. Hypergoniatites with its very narrow external lobe occupies a marginal position in the lower right part of the morphospace. Platygoniatites with its wide EL and high median saddle is found in the left area within the morphospace. Like in the results gained by outline analysis 2, the distribution of the genera in the morphospace visualizes, in the distribution of the data points, the phylogenetic E lobe widening in some evolutionary lineages of the Goniatitoidea (Korn, 1997).
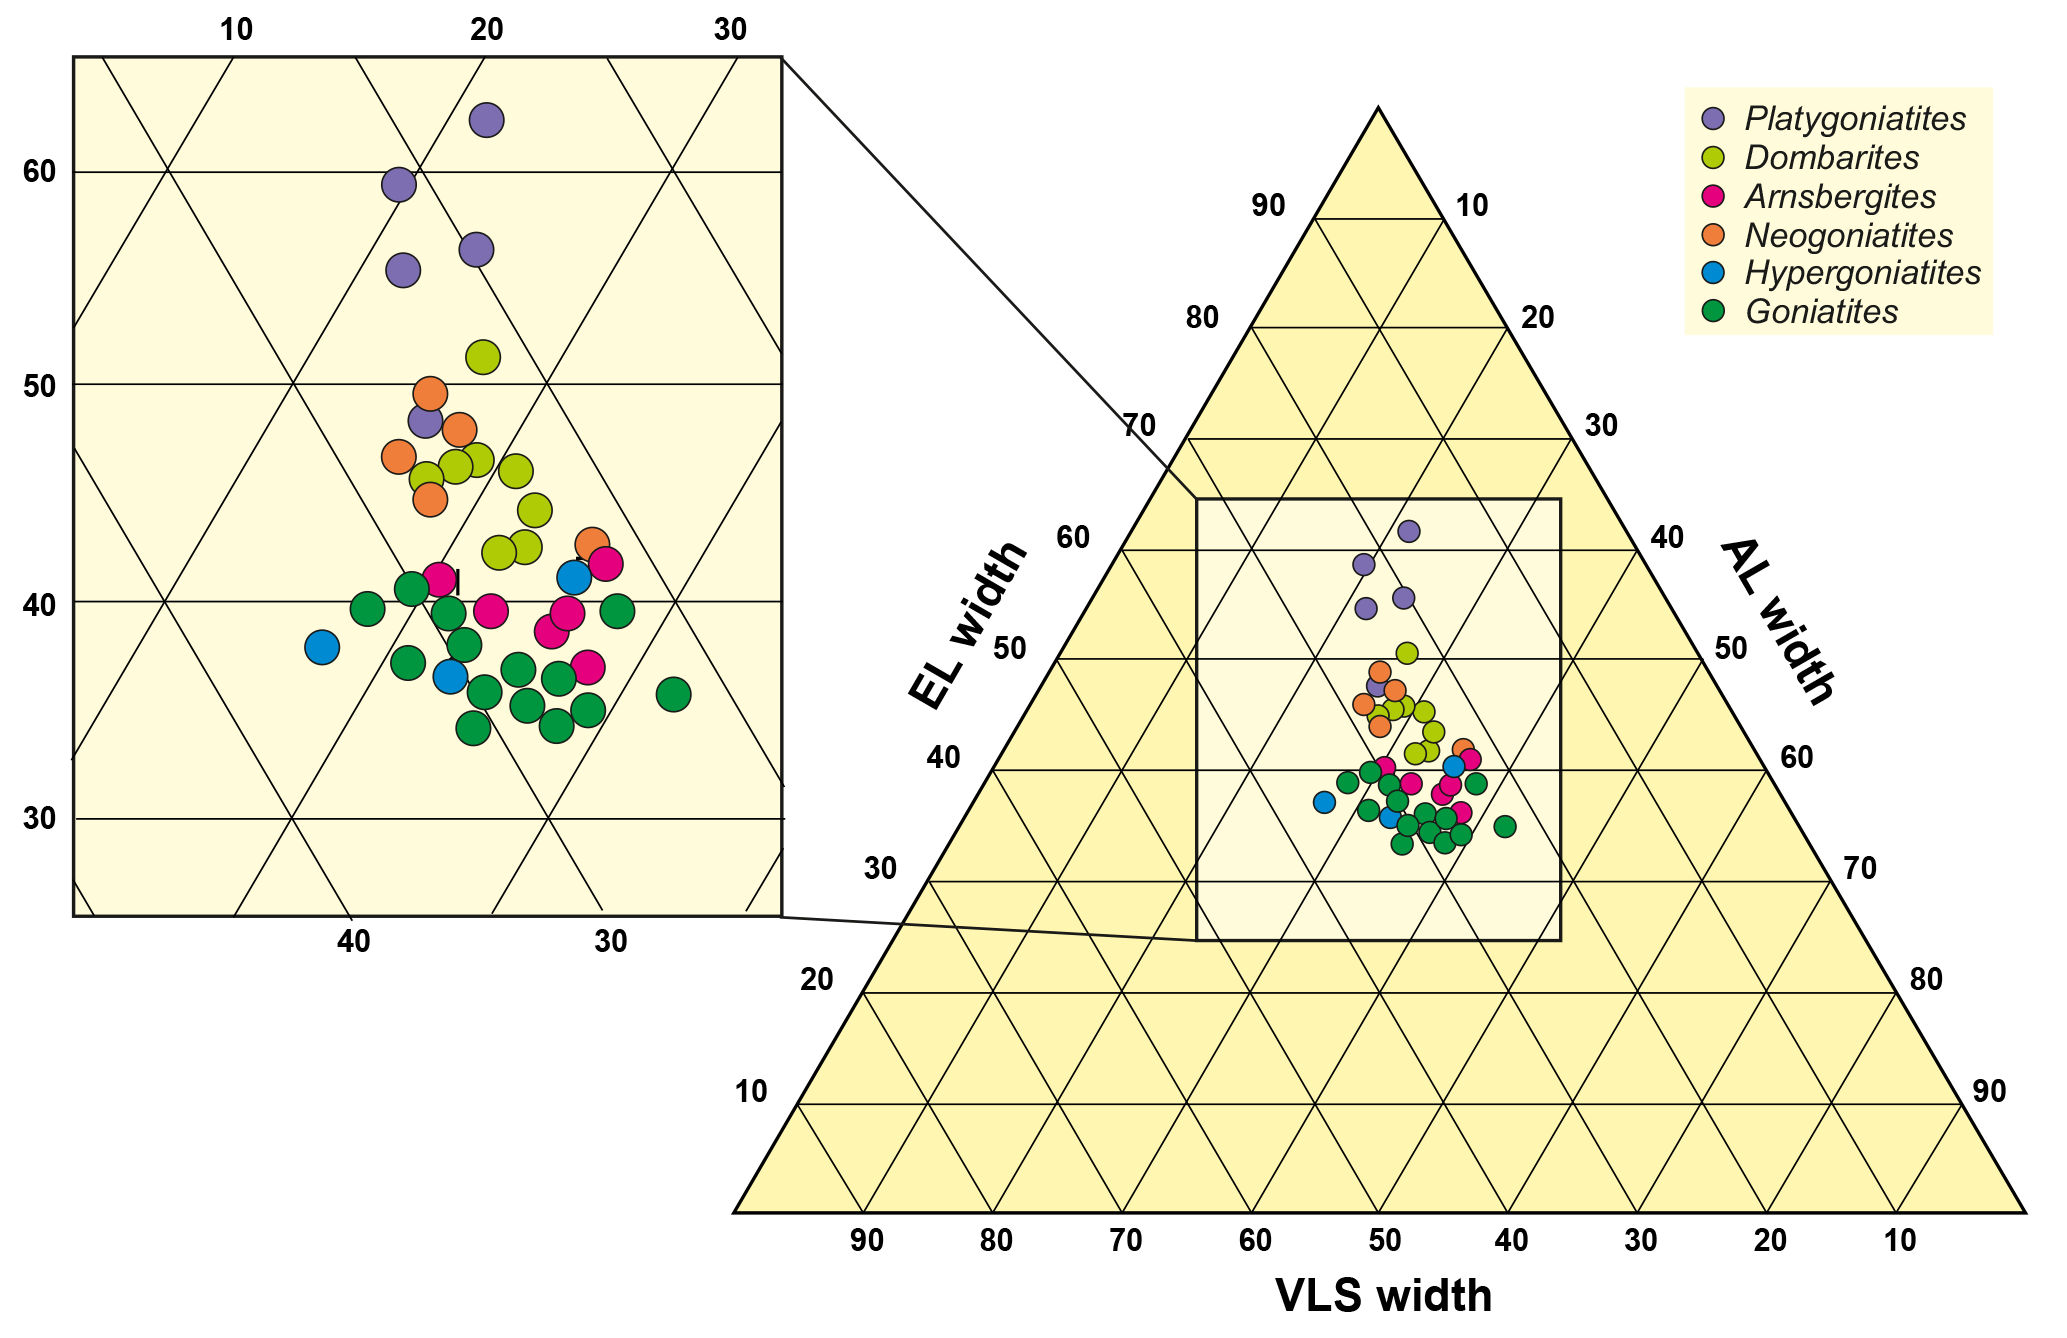
Figure 9Ternary diagram based on the proportions the three sutural elements external lobe (measurement EL5), ventrolateral saddle (VLS3) and adventive lobe (AL). Note that the stratigraphic younger, advanced genera Neogoniatites, Dombarites and particularly Platygoniatites are located in the upper part of the scatter plot (with larger proportion of the width of the external lobe).
3.4 Ternary plots
Within the morphometric analysis of 55 individual suture lines of representatives of the family Goniatitoidea, we obtained width measurements of the external lobe, ventrolateral saddle and adventive lobe. These measurements were obtained in a straight line at half the height of the suture line. We summed up the relative percentages of E lobe, VL saddle and A lobe and plotted them in ternary diagrams.
The phylogenetic tendencies of external lobe widening during the late Early Carboniferous are visible in the ternary diagrams (Fig. 9); particularly the genus Platygoniatites with the widest external lobe shows a separate cluster in this respect. Contrary to this, the point distribution with narrow E lobes is dominated by Goniatites and Hypergoniatites. Arnsbergites, Paraglyphioceras, Lusitanoceras, Hibernicoceras, Progoniatites, Dombarites and Neogoniatites occupy the intermediate field. It can be said that the most important morphological change of the suture line is caused by widening of the external lobe, while the ventrolateral saddle and adventive lobe remain largely unmodified. Among the examined individuals, Goniatites and Dombarites show the widest scattering within the diagram.
The two methods used in the present study – (1) the outline analysis and (2) the quantitative metric analysis of goniatitid suture lines – yielded results that are testable and reproducible. The distribution patterns of the analysed taxa in the morphospace, calculated by using the two independent methods, are strikingly similar (e.g. with species with widened external lobe at the margin of the morphospace); this demonstrates that morphologically similar suture lines cluster together in the morphospace diagrams.
Patterns in the distribution within the morphospace in both methods can be correlated with phylogenetic aspects. Fourier outline analysis 1 demonstrates that the superfamilies Pericycloidea and Goniatitoidea are separated within the occupied morphospace. This result is promising for future analyses with a wider scope of taxa.
The reliability and reproducibility of the analyses described in the present study is dependent on a number of factors. The first of these factors is the precision in the reproduction of the suture line and its digitization. Furthermore, the precision of the metric data and the precision of the outline tracing are important preconditions.
An attempt to study complete suture lines in an outline analysis and EFA was not successful. Probably the complex outline of the suture lines precluded a correct representation. Therefore, distinct regions of the suture lines (E lobe and VL saddle separately) were analysed by the EFA in our study. The essential dimension reduction of the Fourier metadata, done by PCA, enabled the illustration of the results. The different genera occupy separated positions within the total morphospace. The complex and non-stationary pattern of ammonoid suture lines will foster the development of new methods for morphological analysis in the future. In this context, multivariate methods appear to be a suitable tool to encounter the information content of suture lines when taking into account their potential limitations.
The data utilized in this article can be found in the Supplement.
The supplement related to this article is available online at: https://doi.org/10.5194/fr-21-223-2018-supplement.
MW performed the project in the framework of his diploma thesis (Martin-Luther-Universität Halle-Wittenberg) and performed the analyses. DK collected the suture line data and provided the determinations of the analysed species. MW, KDB, and DK discussed the results and wrote the paper.
The authors declare that they have no conflict of interest.
We are indebted to Sonny A. Walton (Potsdam) for proofreading an earlier
version of the manuscript.
Edited by: Christian Klug
Reviewed by: Rene Hoffmann and one anonymous referee
Adams, D. C.: Quantifying and comparing phylogenetic evolutionary rates for shape and other high-dimensional phenotypic data, Syst. Biol., 63, 166–177, 2014.
Adams, D. C. and Otárola-Castillo, E.: geomorph: an R package for the collection and analysis of geometric morphometric shape data, Methods Ecol. Evol., 4, 393–399, 2013.
Adams, D., Rohlf, F. J., and Slice, D.: Geometric morphometrics: Ten years of progress following the `revolution', Ital. J. Zool., 71, 5–16, 2004.
Adams, D. C., Rohlf, F. J., and Slice, D. E.: A field comes of age: geometric morphometrics in the 21st century, Hystrix, 24, 7–14, 2013.
Allen, E. G.: New approaches to Fourier analysis of ammonoid sutures and other complex, open curves, Paleobiology, 32, 299–315, 2006.
Allen, E. G.: Understanding ammonoid sutures: New insight into the dynamic evolution of Paleozoic suture morphology, in: Cephalopods Present and Past: New Insights and Fresh Perspectives, edited by: Landman, N. H., Davis, R. A., and Mapes, R. H., Springer, Dordrecht, 159–180, 2007.
Bockwinkel, J., Korn, D., and Ebbighausen, V.: The ammonoids from the Argiles de Timimoun of Timimoun (Early and Middle Viséan; Gourara, Algeria), Foss. Rec., 13, 215–278, https://doi.org/10.1002/mmng.200900013, 2010.
Bookstein, F. L.: Morphometric tools for landmark data: geometry and biology, Cambridge Univsity Press, New York, 1991.
Bookstein, F. L.: Biometrics, biomathematics and the morphometric synthesis, B. Math. Biol., 58, 313–365, https://doi.org/10.1007/bf02458311, 1996.
Bookstein, F. L.: A hundred years of morphometrics, Acta Zool. Acad. Sci. H., 44, 7–59, 1998.
Bookstein, F. L. and Ward, P. D.: A modified Procrustes analysis for bilaterally symmetrical outlines, with an application to microevolution in Baculites, Paleobiology, 39, 214–234, 2013.
Boyajian, G. E. and Lutz, T. M.: Evolution of biological complexity and its relation to taxonomic longevity in the Ammonoidea, Geology, 20, 983–986, 1992.
Canfield, D. J. and Anstey, R. L.: Harmonic analysis of cephalopod suture patterns, J. Int. Ass. Math. Geol., 13, 23–35, 1981.
Collyer, M. L. and Adams, D. C.: Phenotypic trajectory analysis: comparison of shape change patterns in evolution and ecology, Hystrix, 24, 75–83, 2013.
Corti, M.: Geometric morphometrics: an extension of the revolution, Trends Ecol. Evol., 8, 302–303, 1993.
Damiani, G.: Computer simulation of some ammonoid suture lines, in: Atti II Convengo Internationale: Fossili, Evoluzione, Ambiente, edited by: Pallini, G., Cecca, F., Cresta, S., and Santantonio, M., Pergola-Pessaro, 221–228, 1990.
De Baets, K., Bert, D., Hoffmann, R., Monnet, C., Yacobucci, M. M., and Klug, C.: Ammonoid intraspecific variability, in: Ammonoid Paleobiology: From anatomy to ecology, edited by: Klug, C., Korn, D., De Baets, K., Kruta, I., and Mapes, R. H., Topics in Geobiology 43, Springer, Dordrecht, 359–426, 2015.
Dommergues, C. H., Dommergues, J.-L., and Verrecchia, E. P.: The discrete cosine transform, a Fourier-related method for morphometric analysis of open contours, Math. Geol., 39, 749–763, 2007.
Ebbighausen, V., Korn, D., and Bockwinkel, J.: The ammonoids from the Dalle à Merocanites of Timimoun (Late Tournaisian–Early Viséan; Gourara, Algeria), Foss. Rec., 13, 153–202, https://doi.org/10.1002/mmng.200900011, 2010.
Furnish, W. M. and Unklesbay, A. G.: Diagrammatic representation of ammonoid sutures, J. Paleontol., 14, 598–602, 1940.
Galton, F.: Inquiries into the human faculty & its development, JM Dent and Company, London, 1883.
Gerber, S.: The geometry of morphospaces: lessons from the classic Raup shell coiling model, Biol. Rev., 92, 1142–1155, 2017.
Gildner, R. F.: A Fourier method to describe and compare suture patterns, Palaeontol. Electron., 6, 1–12, 2003.
Hammer, Ø., Harper, D. A. T., and Ryan, P. D.: PAST: Paleontological Statistics Software Package for Education and Data Analysis, Palaeontologica Electronica, 4, 1–9, 2001.
Hoffmann, R., Weinkauf, M. F. G., and Fuchs, D.: Grasping the shape of belemnoid arm hooks – a quantitative approach, Paleobiology, 43, 304–320, 2017.
Hoffmann, R., Lemanis, R. E., Falkenberg, J., Schneider, S., Wesendonk, H., and Zachow, S.: Integrating 2D and 3D shell morphology to disentangle the palaeobiology of ammonoids: a virtual approach, Palaeontology, 61, 89–104, 2018.
Klingenberg, C. P.: Novelty and “homology-free” morphometrics: what's in a name?, Evol. Biol., 35, 186–190, 2008.
Klug, C., Döring, S., Korn, D., and Ebbighausen, V.: The Viséan sedimentary succession at the Gara el Itima (Anti-Atlas, Morocco) and its ammonoid faunas, Foss. Rec., 9, 3–60, https://doi.org/10.1002/mmng.200600001, 2006.
Korn, D.: Die Goniatiten des Kulmplattenkalkes (Cephalopoda, Ammonoidea; Unterkarbon; Rheinisches Schiefergebirge), Geologie und Paläontologie in Westfalen, 11, 1–293, 1988.
Korn, D.: Evolution of the Goniatitaceae and Visean-Namurian biogeography, Acta Palaeontol. Pol., 42, 177–199, 1997.
Korn, D.: Goniatites sphaericus (Sowerby, 1814), the archetype of Palaeozoic ammonoids: a case of decreasing phenotypic variation through ontogeny, PalZ, 91, 337–352, https://doi.org/10.1007/s12542-017-0366-4, 2017.
Korn, D. and Ebbighausen, V.: The Early Carboniferous (Mississippian) ammonoids from the Chebket el Hamra (Jerada Basin, Morocco), Foss. Rec., 11, 83–156, https://doi.org/10.1002/mmng.200800004, 2008.
Korn, D. and Kaufmann, B.: A high-resolution relative time scale for the Viséan Stage (Carboniferous) of the Kulm Basin (Rhenish Mountains, Germany), Geol. J., 44, 306–321, 2009.
Korn, D. and Klug, C.: Ammoneae Devonicae, Fossilium Catalogus, I: Animalia, edited by: Riegraf, W., Backhuys, Leiden, 1–375, 2002.
Korn, D. and Titus, A. L.: Goniatites Zone (middle Mississippian) ammonoids of the Antler Foreland Basin (Nevada, Utah), B. Geosci., 86, 107–196, https://doi.org/10.3140/bull.geosci.1242, 2011.
Korn, D., Bockwinkel, J., Ebbighausen, V., and Klug, C.: Palaeobiogeographic and evolutionary meaning of an early Late Tournaisian ammonoid fauna from the Tafilalt of Morocco, Acta Palaeontol. Pol., 48, 71–92, 2003.
Korn, D., Klug, C., and Mapes, R. H.: The Lazarus ammonoid family Goniatitidae, the tetrangularly coiled Entogonitidae, and Mississippian biogeography, J. Paleontol., 79, 356–365, 2005.
Korn, D., Bockwinkel, J., and Ebbighausen, V.: The ammonoids from the Argiles de Teguentour of Oued Temertasset (early Late Tournaisian; Mouydir, Algeria), Foss. Rec., 13, 35–152, https://doi.org/10.1002/mmng.200900010, 2010.
Korn, D., Titus, A. L., Ebbighausen, V., Mapes, R. H., and Sudar, M. N.: Early Carboniferous (Mississippian) ammonoid biogeography, Geobios, 45, 67–77, https://doi.org/10.1016/j.geobios.2011.11.013, 2012.
Kuhl, F. and Giardinia, C. R.: Elliptic Fourier features of a closed contour, Comput. Vision. Graph., 18, 236–258, 1982.
Kullmann, J.: Die Goniatiten des Unterkarbons im Kantabrischen Gebirge (Nordspanien). I. Stratigraphie. Paläontologie der U.O. Goniatitina Hyatt, Neues Jahrbuch für Geologie und Paläontologie, Abhandlungen, 113, 219–326, 1961.
Kullmann, J. and Wiedmann, J.: Significance of sutures in phylogheny of Ammonoidea, University of Kansas, Paleontological Contributions, 47, 1–32, 1970.
Lazarus, D.: Tempo and mode of morphologic evolution near the origin of the radiolarian lineage Pterocanium prismatium, Paleobiology, 12, 175–189, 1986.
Le Minor, J. and Schmittbuhl, M.: Importance of elliptic Fourier methods for morphometry of complex outlines: application to the distal human femur, Surg. Radiol. Anat., 21, 387–391, 1999.
Long, C. A.: Intricate sutures as fractal curves, J. Morphol., 185, 285–295, 1985.
Lutz, T. M. and Boyajian, G. E.: Fractal geometry of ammonoid sutures, Paleobiology, 21, 329–342, 1995.
MacLeod, N.: Phylogenetic signals in morphometric data, in: Morphology, Shape and Phylogeny, edited by: MacLeod, N. and Forey, P. L., Taylor & Francis, London, New York, 100–138, 2002.
Manship, L. L.: Pattern matching: classification of ammonitic sutures using GIS, Palaeontologia Electronica, 7, 1–15, 2004.
Meischner, D. and Nemyrovska, T.: Origin of Gnathodus bilineatus (Roundy, 1926) related to goniatite zonation in Rheinisches Schiefergebirge, Germany, Bolletino della Società Paleontologica Italiana, 37, 427–442, 1999.
Mitteroecker, P. and Gunz, P.: Advances in geometric morphometrics, Evol. Biol., 36, 235–247, 2009.
Monnet, C., De Baets, K., and Klug, C.: Parallel evolution controlled by adaptation and covariation in ammonoid cephalopods, BMC Evol. Biol., 11, 1–21, 2011.
Monnet, C., Klug, C., and De Baets, K.: Evolutionary patterns of ammonoids: phenotypic trends, convergence, and parallel evolution, in: Ammonoid Paleobiology: From macroevolution to paleogeography, Springer, Dordrecht, 95–142, 2015.
Olóriz, F., Palmqvist, P., and Pérez-Claros, J. A.: Shell features, main colonized environments, and fractal analysis of sutures in Late Jurassic ammonites, Lethaia, 30, 191–204, 1997.
Olóriz, F., Palmqvist, P., and Pérez-Claros, J. A.: Recent advances in morphometric approaches to covariation of shell features and the complexity of suture lines in Late Jurassic ammonites, with reference to the major environments colonized, in: Advancing research on living and fossil cephalopods, edited by: Olóriz, F. and Rodríguez-Tovar, F. J., Springer, Boston, MA, 273–293, 1999.
Pérez-Claros, J. A. and Bengtson, P.: Evolution of complexity and natural selection: Suture complexity and its relation to taxonomic longevity in Cretaceous ammonoids, Cretaceous Res., 88, 55–61, 2018.
Pérez-Claros, J. A., Palmqvist, P., and Olóriz, F.: First and second orders of suture complexity in ammonites: a new methodological approach using fractal analysis, Math. Geol., 34, 323–343, 2002.
Pérez-Claros, J. A., Oloriz, F., and Palmqvist, P.: Sutural complexity in Late Jurassic ammonites and its relationship with phragmocone size and shape: a multidimensional approach using fractal analysis, Lethaia, 40, 253–272, 2007.
Polly, P. D.: Developmental dynamics and G-matrices: can morphometric spaces be used to model phenotypic evolution?, Evol. Biol., 35, 83–96, 2008.
Polly, P. D. and Motz, G. J.: Patterns and processes in morphospace: geometric morphometrics of three-dimensional objects, The Paleontological Society Papers, 22, 71–99, 2016.
Rohlf, F. J.: tps-Dig, available at: http://life.bio.sunysb.edu/morph/ (last access: 10 April 2018), 2011.
Ruzhencev, V. E.: Printsipy sistematiki, sistema i filogeniya paleozoyskikh ammonoidey., Trudy Paleontologicheskogo Instituta Akademiya Nauk SSSR, 83, 1–331, 1960.
Ruzhencev, V. E. and Bogoslovskaya, M. F.: Namyurskiy etap v evolyutsii ammonodey. Rannenamyurskiye ammonoidei, Trudy Paleontologicheskogo Instituta Akademiya Nauk SSSR, 133, 1–382, 1971.
Saunders, W. B. and Work, D. M.: Shell morphology and suture complexity in Upper Carboniferous ammonoids, Paleobiology, 22, 189–218, 1996.
Saunders, W. B. and Work, D. M.: Evolution of shell morphology and suture complexity in Paleozoic prolecanitids, the rootstock of Mesozoic ammonoids, Paleobiology, 23, 301–325, 1997.
Saunders, W. B., Greenfest-Allen, E., Work, D. M., and Nikolaeva, S. V.: Morphologic and taxonomic history of Paleozoic ammonoids in time and morphospace, Paleobiology, 34, 128–154, 2008.
Thompson, D. A. W.: On growth and form, Cambridge University Press, Cambridge, Massachusetts, 1917.
Titus, A. L., Korn, D., Harrell, J. E., and Lambert, L. L.: Late Viséan (late Mississippian) ammonoids from the Barnett Shale, Sierra Diablo Escarpment, Culberson County, Texas, USA, Foss. Rec., 18, 81–104, https://doi.org/10.5194/fr-18-81-2015, 2015.
Ubukata, T., Tanabe, K., Shigeta, Y., Maeda, H., and Mapes, R. H.: Eigenshape analysis of ammonoid sutures, Lethaia, 43, 266–277, 2010.
Ubukata, T., Tanabe, K., Shigeta, Y., Maeda, H., and Mapes, R. H.: Wavelet analysis of ammonoid sutures, Palaeontol. Electron., 17, 1–17, 2014.
von Linné, C.: Systema Naturae per regna tria Naturae, Secundum Classes, Ordines, Genera, Species, cum characteribus, differentiis. Synonymis, locis. Tomus I. Editio decima, reformata, Laurentii Salvii, Holmiae, 1758.
Wang, Q., Korn, D., Nemyrovska, T., and Qi, Y.: The Wenne river bank section – an excellent section for the Viséan–Serpukhovian boundary based on conodonts and ammonoids (Mississippian; Rhenish Mountains, Germany), Newsl. Stratigr., 51, 427–444, 2018.
Wedekind, R.: Die Genera der Palaeoammonoidea (Goniatiten). Mit Ausschluß der Mimoceratidae, Glyphioceratidae und Prolecanitidae, Palaeontographica, 62, 85–184, 1918.
Wiedmann, J. and Kullmann, J.: Ammonoid sutures in ontogeny and phylogeny, in: The Ammonoidea, edited by: House, M. R. and Senior, J. R., Systematics Association Special Volume, Academic Press, London, 18, 215–255, 1981.
Yacobucci, M. M. and Manship, L. L.: Ammonoid septal formation and suture asymmetry explored with a geographic information systems approach, Palaeontologia Electronica, 14, 1–17, 2011.